Esri is perhaps best known as the company behind ArcGIS, the world’s leading geospatial platform, but the Humans in Crisis Meetup held in Los Angeles, U.S., earlier this month offered a window into something less visible: the deep and growing community of humanitarian organizations using that platform to save lives. With sessions covering wildfire response, earthquake search and rescue, and medical supply chain logistics, one of the throughlines of the day was the question of how to get the right information to the right people fast enough to matter.
I had the privilege of presenting on behalf of Dataminr, walking participants through the breadth of real-time data available through our platform and the possibilities it unlocks within Esri’s ecosystem. Below are some of the key themes and takeaways from the day.
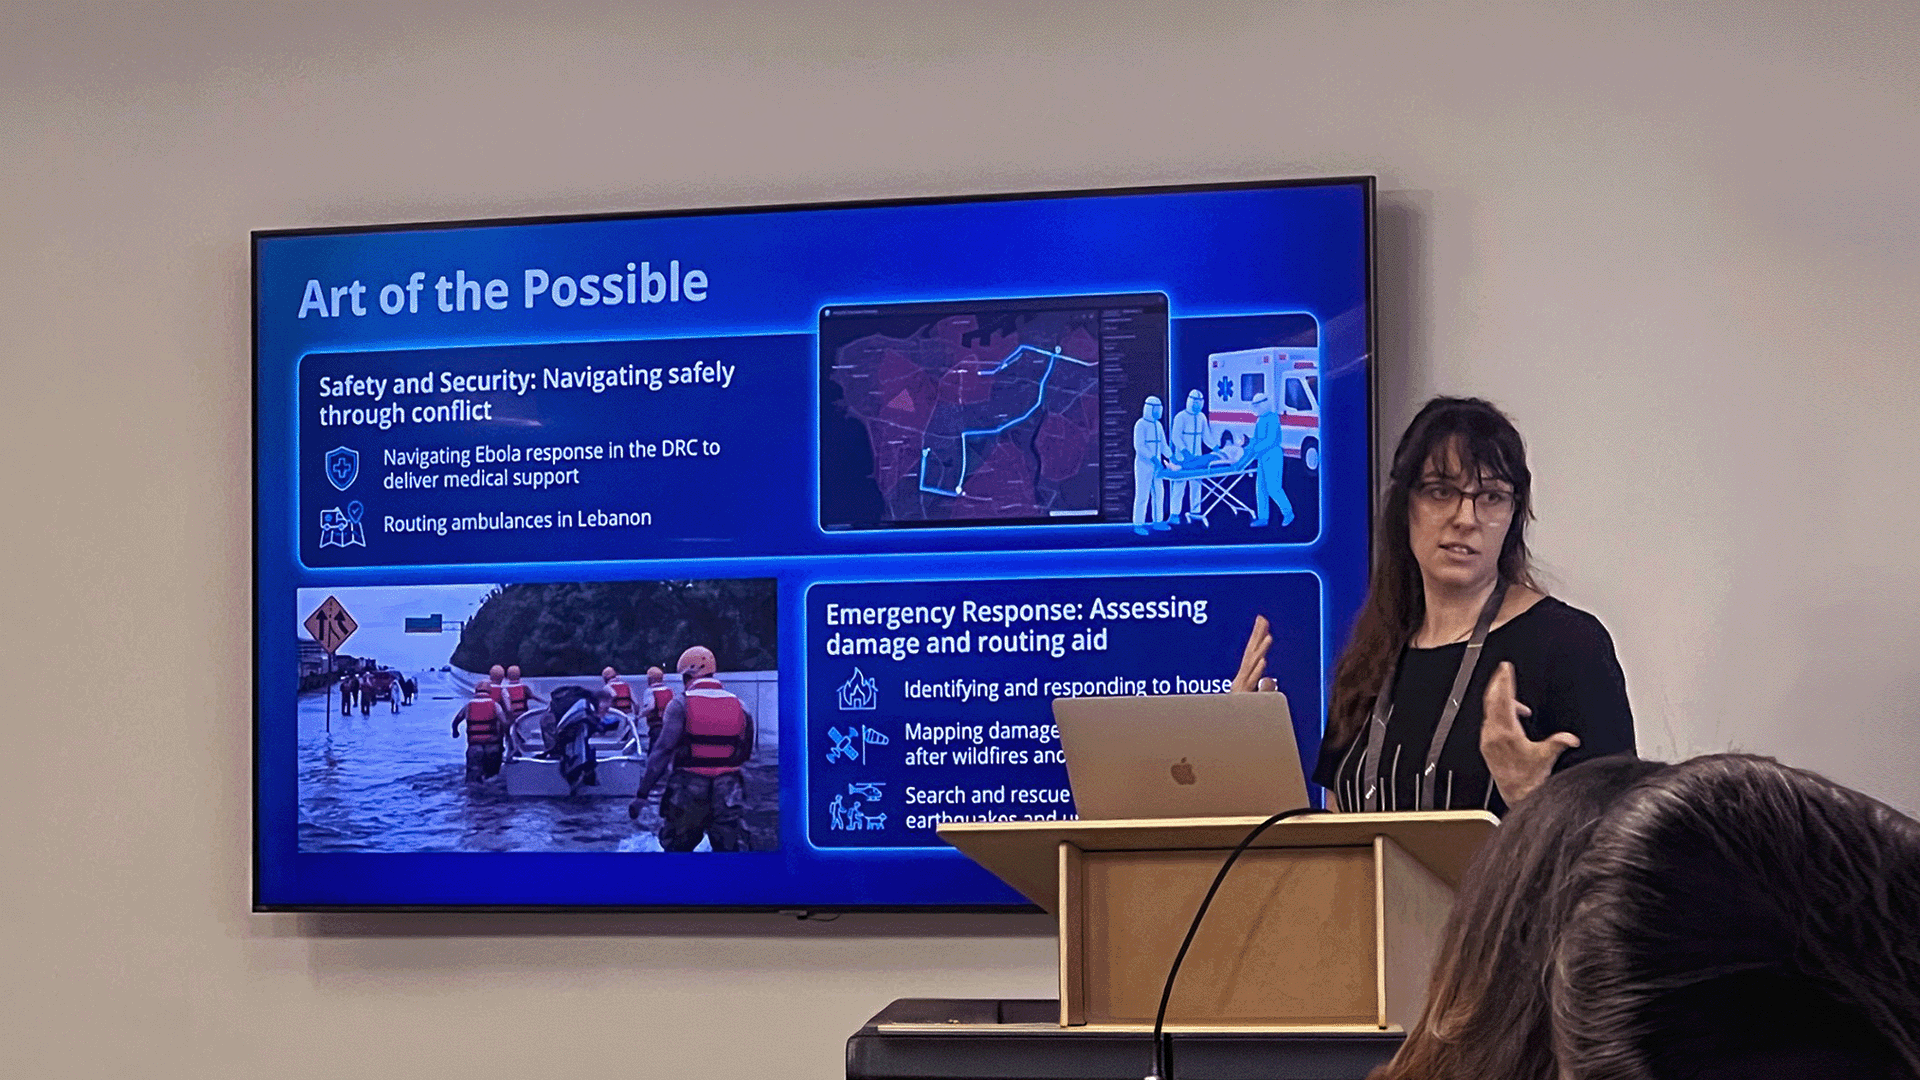
GIS as a Nervous System for Humanitarian Response
Esri’s own framing, “a nervous system for the planet,” captures something important about the role geospatial infrastructure plays in crisis response. Far from just a mapping tool, GIS is a system for aggregating, visualizing, and communicating information at scale, integrating data from diverse sources like weather feeds, damage assessments, volunteer rosters, and real-time event streams into a single common operating picture. A recurring theme across various speaking sessions was the importance of interoperable, ready-to-deploy solutions: tools that organizations can actually use under pressure, without having to build something new in the middle of a crisis.
What Dataminr Brings to the Map
My presentation centered on a simple idea: real-time intelligence becomes even more powerful when it’s mapped alongside additional context — including population demographics, environmental hazards, infrastructure data, and the wealth of other information available through sources like Esri’s Living Atlas. Dataminr ingests information from over one million public data sources and uses proprietary AI models to make sense of it, enriching every alert with geolocation data, topic labels, journalistic captions, and links to original source material. The result is a continuous stream of geolocated events that can function as a live layer within Esri: incidents appearing on a map as they happen, filterable by topic and geography, and actionable within the same platform where teams are already doing their response work.
The Dataminr-Esri partnership’s use cases span a wide spectrum of humanitarian operations, from navigating Ebola response corridors in the Democratic Republic of the Congo and routing ambulances in Lebanon, to mapping infrastructure damage in the aftermath of a hurricane and supporting search and rescue after an earthquake. In each case, the value is the same: critical information is delivered to responders before the window to act closes.
The Breadth and Diversity of Dataminr’s Public Data Sources
- More than 220 countries and territories covered in over 150 languages
- Over 1 million unique public multi-modal data sources, including text, image, video, sensors, and audio
- More than 43 terabytes of text processed every day
Turning Information Overload Into Actionable Intelligence: Direct Relief
Dataminr’s ability to apply real-time data feed to the specific needs of a humanitarian organization was demonstrated by Direct Relief, which works with more than 2,000 partners across 130 countries to get medicines and medical products from where they’re made to where they need to be used.
When a disaster strikes, Direct Relief’s immediate operational question is: which of our partners are affected, and what do they need right now? Answering that question quickly enough to matter, without being overwhelmed by the volume of incoming information, is exactly where Dataminr comes in.
Direct Relief relies on Dataminr’s alert layer in Esri to assess the impact of natural disasters on the infrastructure their partners depend on: whether roads are passable, whether power is out, or whether a wildfire or hurricane has increased the burden on clinics trying to distribute medication or driven up demand for specific medical supplies. That specificity matters. The configuration work of defining watch areas, selecting topics, and tuning keywords to organizational context is what converts a data stream into an actionable intelligence feed.
What the Humanitarian GIS Community Needs
Organizations at the meetup surfaced a clear common set of needs:
- Real-time, geolocated event data that integrates natively into existing GIS workflows — not a separate tool to check, but a live layer within the platform where response is already happening.
- Separating signal from noise: the ability to filter high-volume data streams by geography, topic, and organizational context, so responders can see what’s crucial without being overwhelmed by irrelevant data points.
- Interoperability across platforms and communications channels, so that intelligence reaches decision-makers wherever they are, not just those with access to a GIS portal.
- Locally-grounded coverage: on-the-ground, in-language data sources that provide ground-truth awareness in places where crisis response is actually happening.
These are not abstract requirements. They are the specific, practical pain points that practitioners described from direct operational experience. And they are exactly the problems that a Dataminr and Esri integration is positioned to address.

Dataminr for Nonprofits
Dataminr for Nonprofits offers free and discounted access to our event, threat & risk intelligence solutions, so humanitarian organizations can know first, act faster and better serve the world’s most vulnerable—all while keeping aid workers safe.
Learn More