

Introduction
In June 2026, Anthropic’s Frontier Red Team tested 21 Windows kernel vulnerabilities that had already been disclosed and patched. Its Mythos Preview model reproduced 18 of them, the first in 31 minutes, and built eight full privilege-escalation exploits (Anthropic Frontier Red Team, June 2026).
None of them were zero-days. They were n-days: known, published flaws, the kind already sitting in your scanner report. The risk isn’t only what attackers discover. It’s what they can now do with what you already know about.
The numbers point the same way. FIRST expects about 66,000 new Common Vulnerabilities and Exposures (CVEs) in 2026. Mandiant’s M-Trends 2026 puts the mean time to exploit at minus seven days and Edgescan found that high and critical application and API vulnerabilities take an average of 74.3 days to remediate. The volume keeps growing and attackers keep getting faster, while remediation still takes more than ten weeks.
Most programs still rank work by Common Vulnerability Scoring System (CVSS) score and judge themselves on patch speed and vulnerability counts. That only works if the gap between disclosure and exploit is long enough to chew through a list. It isn’t anymore, so speed stops being a defense. The better question is which few exposures can actually hurt you. Early warning helps: Dataminr detected the Fortinet FortiWeb zero-day 38 days before CISA added it to its Known Exploited Vulnerabilities (KEV) catalog (Dataminr Intel Brief, Fortinet FortiWeb, 2025). But a head start only helps if the threat applies to you, your controls don’t already stop it, and it would cost the business enough to act.
By the end of this guide, you’ll know how much of your vulnerability backlog your controls already cover, have a short list of the exposures worth patching this week ranked by what they’d cost the business, and know the exact control gap and assets behind each one.
Key takeaways
- AI can now build exploits for known, already-patched flaws in hours, so ranking by CVSS score and patching faster no longer keeps up.
- Most of a backlog isn’t real risk. In this guide’s illustrative data, existing controls already cover about 72% of 20,792 CVEs, and only three are costly enough to the business to count as material.
- Severity scores can’t tell exposures apart. In the same data, two CVEs both scored 9.8: one was fully blocked by existing controls and rated Non-Material despite 51.9 days of early warning, and the other had no control coverage and would cost $4.6M.
- Patch when an exposure is Material and uncovered, compensate when you can’t patch, and accept when it’s Non-Material.
How Dataminr PTEM Narrows a Vulnerability Backlog in Three Filters
Dataminr PTEM (Predictive Threat Exposure Management) puts every exposure through three filters:
- Is anyone going after it? Dataminr Threat Intelligence watches for signs a vulnerability is being targeted, from dark web forums, code repositories and early exploit activity, sometimes before it’s public, and matches them to the vulnerabilities you actually have.
- Do your controls already stop it? PTEM checks whether the security tools you already run block the attack techniques each vulnerability relies on, asset by asset.
- What would it cost you? What’s left gets a financial figure for your business, measured against your business’s materiality threshold.
A scanner tells you what’s vulnerable. A threat feed tells you what’s being targeted. Neither knows whether your controls already stop it or what it would cost you. PTEM answers all three together and the four steps below show you where to see each answer.
Prerequisites
- Dataminr PTEM, with at least one vulnerability scanner (for example Tenable) and one endpoint detection and response (EDR) tool (for example CrowdStrike Falcon) connected. Adding a cloud security tool extends the analysis to cloud workloads. Your Dataminr team sets this up with you during onboarding.
- Your firmographics: industry, revenue and region are enough to start. Add revenue at risk or sensitive records at risk (such as personally identifiable information, protected health information or payment card data) as business assets if you want to see that impact.
Step 1: Open the Vulnerability Analysis Dashboard to See How Much Is Real Risk
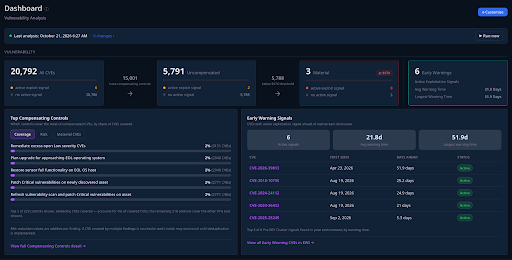
Once the integration has run and data loaded, open the Dashboard, click Customize and choose Vulnerability Analysis.
The top row is your backlog, filtered. It starts with every CVE PTEM found across your assets, takes away the ones your compensating controls already cover, then takes away the ones whose financial impact falls below your materiality threshold. In the example shown here, 20,792 CVEs become 5,791 uncompensated and 5,791 become three material.
Two panels underneath tell you where to look first:
- Top Compensating Controls ranks control fixes by how many CVEs each one covers, because one fix can cover many CVEs at once.
- Early Warning Signals lists CVEs in your environment with signs of attacker interest that came before confirmed exploitation and how far ahead the warning came. In this example, the largest was 51.9 days ahead of the CISA KEV listing.
This is the answer to the question every backlog raises: how much of it is real risk? In this example, your controls already handle most of it. In your environment, this row shows you how much.
Step 2: Work the Priority List to Rank Exposures by Financial Impact
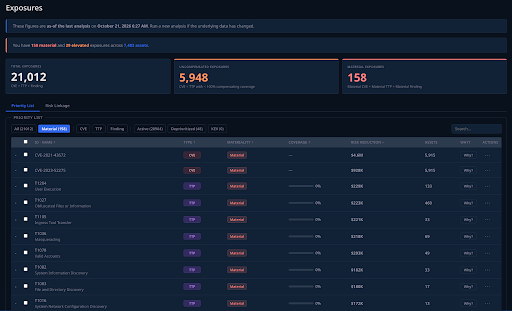
In the left menu, click Exposures. The Priority List tab opens by default. Click the Material filter.
This is one list of CVEs, attack techniques and control findings, with a Risk Reduction figure on every row: the financial exposure you’d remove by fixing it. Click the Risk Reduction column header to rank the list by financial impact rather than severity score. In this example, the Material filter narrows 21,012 exposures, across CVEs, techniques and control findings, to 158. You can also filter by type (CVE, TTP or Finding), see what’s been Deprioritized, or search for a specific CVE.
Because techniques and control findings sit in the same list as CVEs, you can see when fixing one control gap would remove more exposure than patching any single vulnerability.
Step 3: Read the “Why?” Panel to See Why an Exposure Matters
Click Why? on a row and read it in three parts.
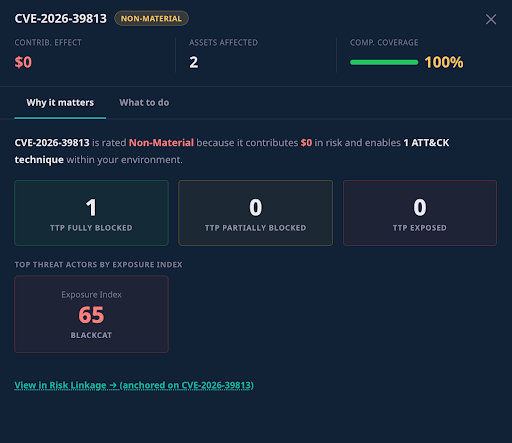
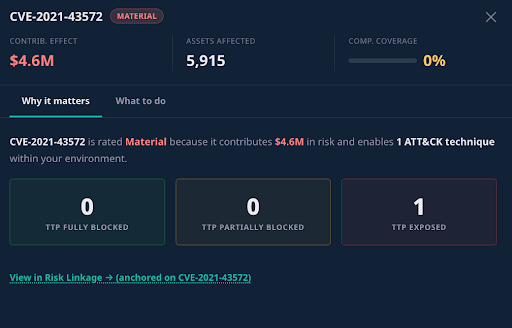
Financial impact. The header shows the exposure’s Contrib. Effect, its financial contribution to your exposure, and how many assets it affects. The figure comes from what you’ve told PTEM about the business: revenue, operating income, and the business assets you want measured, such as revenue at risk, data records or a custom loss category you define.
Control coverage. The Why it matters tab shows how many attack techniques the exposure enables, and whether your controls fully block, partially block or leave each one exposed. Comp. Coverage sums it up.
What to do. The What to do tab names the compensating controls for it, with each one’s coverage and the techniques it blocks.
Now compare two CVEs from this example. Both have a CVSS score of 9.8.
- The first has an early-warning signal: Dataminr’s first mention came 51.9 days before it reached the CISA KEV list. But its one technique is fully blocked, coverage is 100% and it’s rated Non-Material.
- The second has no early-warning signal. Its one technique is exposed, coverage is 0% across 5,915 assets, and it contributes $4.6M to financial exposure. It’s rated Material, and it’s first on the Priority List.
Read together, that’s the case against patching by severity. A CVSS score can’t tell these two apart and early warning on its own would point you to the first one. Early warning tells you where to look. Controls and cost tell you whether to act.
Step 4: Trace the Fix in Risk Linkage to Find the Gap and the Assets
From any material CVE’s Why? panel, click View in Risk Linkage.
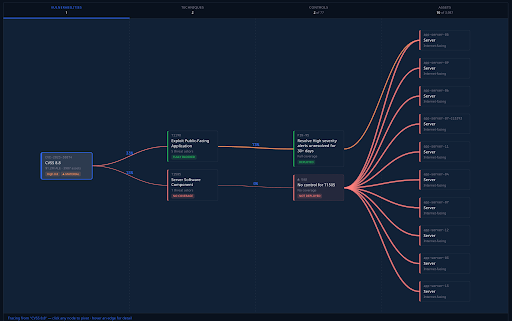
The screen reads left to right in four columns: the vulnerability, the attack technique it enables, the controls that cover that technique, or the gap where none do, and the assets affected. Click any node to pivot the view around it.
In the example below, a material CVE with a CVSS score of 8.8 enables two attack techniques. A deployed control already fully blocks T1190, Exploit Public-Facing Application. Nothing covers T1505, Server Software Component, so the Controls column shows Gap: No control for T1505. The Assets column shows the affected assets, the first 10 of 3,987 here, all internet-facing servers. That’s a specific fix, on specific assets, with the financial impact it removes.
Then make the call:
- Patch when it’s Material and your controls don’t cover it. It goes to the top of this week’s list.
- Compensate when you can’t patch. Risk Linkage and the Findings page show the control fixes that would reduce your exposure the most.
- Accept when it’s Non-Material, meaning its financial impact falls below your materiality threshold. Exposures rated Elevated sit just below Material, so review them before accepting. Document the reason and move on.
What You Have Now
You now have a backlog filtered down to what your controls don’t already cover and a short list of material exposures ranked by what they’d cost the business. Every exposure on it comes with a reason, from early warning to control coverage to financial impact, and a direct line to the control gap and assets you need to fix.
Deciding what matters stops being a weekly sort by severity score. It becomes a list PTEM refreshes each time the analysis runs on new data from your tools, and if a control stops covering a technique, the vulnerabilities that rely on it move back up.
Getting Started
If you already run PTEM, start at Step 1: open the Vulnerability Analysis dashboard and work the material exposures through Steps 2 to 4. If you don’t, request a demo and we’ll walk you through it.
CVSS measures how severe a flaw could be in general, and the Exploit Prediction Scoring System (EPSS) estimates how likely it is to be exploited in general. Neither knows whether attackers targeting organizations like yours are using it, whether your controls already block it, or what it would cost you.
No. It means it isn’t your most urgent work right now. If a control stops covering a technique, the affected vulnerabilities move back up your list.
No signal doesn’t mean safe. It still goes through the control and financial filters, and a material exposure your controls don’t cover is worth fixing even when no one is talking about it yet.
PTEM compares each exposure’s financial contribution with a materiality threshold for your business: the greater of a set percentage of your total financial exposure or a fixed minimum, configured under Manage → Model → Materiality. Exposures above it are Material. Those just below are Elevated, and everything else is Non-Material.
No. PTEM connects to the security tools you already use. There’s no agent on your endpoints.
Sources
- Anthropic Frontier Red Team, n-day exploits study, June 8, 2026: red.anthropic.com/2026/n-days
- Fortinet FortiWeb, 38 days before CISA KEV: Dataminr Intel Brief, 2025, as cited in AI Risk Detection (Dataminr, Oct 1, 2026)
- CVE forecast: FIRST, mid-year revision, June 15, 2026
- Mean time to exploit: Mandiant M-Trends 2026
- Mean time to remediate: Edgescan 2025 Vulnerability Statistics Report

Predictive & Risk Quantified Continuous Threat Exposure Management
Learn how to move beyond exposure guesswork—prove control gaps, quantify financial risk, and drive real, risk-prioritized remediation.
Get PTEM